Audit report
Identify accounting irregularities with Codat's Audit report
Credit decision-making requires accurate and up-to-date data. Codat’s Audit report identifies indicators of inaccurate or out-of-date accounts, helping you to make decisions with confidence.
The report includes insight into when records were last updated, and profit and loss trends. The report displays three years of historical data from the month the report was generated.
Prerequisites
The report contains data based on the data types you have enabled. If a data type is missing, the data associated with it will be omitted.
The Audit Report requires an accounting integration with at least one of the following data types enabled:
- Profit and Loss (enabled by default when Lending API is activated for your Codat client)
- Credit Notes
- Invoices
- Payments
- Sales Orders
- Purchase Orders
- Bills
- Bill Payments
- Bill Credit Notes
The Excel file generated contains the UnAnalyzedDataTypes field in the Report Info sheet which lists the data types that are required to maximize the value of the Audit Report but are disabled. It is recommended you enable these data types.
Data types can be enabled in the Portal.
Generating the report
The Audit report can be generated via API or through Codat's Portal. The Excel reports page describes how to generate and download the report via API.
Understanding the report
This section describes each of the sections and metrics that make up the Audit report.
Report Info
This section provides general information about the metrics contained in this report.
The image below shows the fields in the Report Info. Borders and styling were added to this image for clarity but are not included in the downloadable Excel file.

This sheet provides the following general information about the report:
- The date the report was generated.
- The from and to dates for the data contained in the report.
- The data types that were analyzed (the
AnalyzedDataTypesfield) to produce the report. - The data types that were not used (the
UnAnalyzedDataTypesfield) to generate this report. To maximize the value of the Audit report, you should enable these data types.
Processing summary
The processing summary is an exception report that provides insight into issues encountered when producing a metric in the Audit Report. It consists of:
- Type: The message type which can be: Information, Warning and Error.
- Related metric: The metric sheet the message relates to, for example, Round Sum.
- Related data type: The data type relevant for the metric, for example,
salesOrders. - Message: An informative message, for example: "The data type does not contain any records."
Records Last Updated
Recently updated records are preferred when assessing a company's financials. This section shows when the required records were last updated.
Report structure
The image below shows the fields in the Records Last Updated report. This report displays the number of days ago a record was last updated by data type.
Borders and styling were added to this image for clarity but is not included in the downloadable Excel file.
Report fields
- DataType: The data types that are required to produce the account metrics. The
DataTypeAny relates to the data type that was most recently modified. In the example above, this would bepaymentswhich was modified one day ago. - HasRecords: Outlines if the data type has any records.
- Days: The days since the account was last updated compared against the
to datefor the data contained in the report.
Profit and loss trends
This section of the Audit Report displays Gross Profit, Net Operating Profit and Net Profit metrics on a month-by-month basis with percentage change and yearly summaries. This offers insight into any extreme changes that could be indicative of abnormal growth, fraud or additional debt taken on by the company.
Explore categorized profit and loss statement to see the full report.
Report structure
The report displays three years of historic data from the month the report was generated. For example, running the report on Oct 10, 2022 will return data from Nov 2019 to Oct 2022.
The image below is an extract of the Profit and Loss Trend report that shows the Gross Profit metrics. The Net Operating Profit and Net Profit sections aren’t included here, but they follow the same principles.
Borders and styling were added to this image for clarity but is not included in the downloadable Excel file.
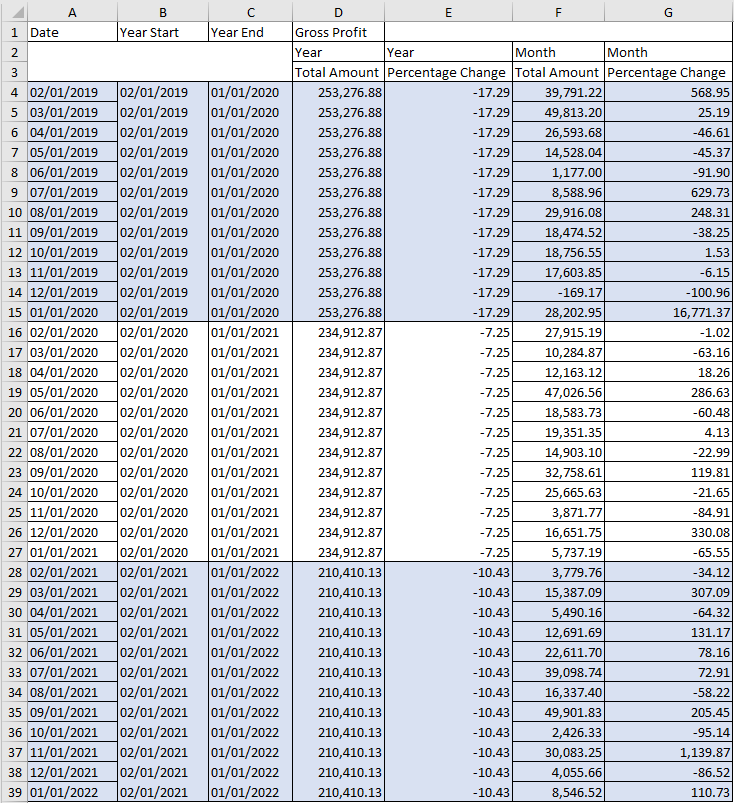
If the most recent or oldest data doesn’t exist, only those dates will be omitted from the report. In other words, you may not always get a full three years of data. Similarly, if a fourth year’s (the oldest) data doesn’t exist, the percentage change will not be calculated.
How is the first year's percentage change calculated?
A fourth year of data, in this example from 02/01/2018 to 01/01/2019, is used to calculate the percentage change of the earliest of the three years. The fourth year's data is not however included in the report.
Report fields
- Date: The date format is MM/DD/YYYY.
- Year Start and Year End: Clearly shows the start and end dates of each of the three years. This is needed because confusion can arise due to the start year being based on the date the report was generated, going back three years. It’s not based on a calendar or financial year.
- Gross Profit:
- Total Amount (Year): The total amount for the year. The value is repeated for each month for a given year.
- Percentage Change (Year): The percentage change compared to the previous year. In this example, the percentage difference for year 3 compared to year 2 is
((210,410.13 / 234,912.87)-1) * 100 = -10.43%. - Total Amount (Month): The amount as at the end of the month. The month that the report is generated will provide the total to date for that month.
- Percentage Change (Month): The percentage change compared to the previous month.
Round Sum
A round sum value is where the total amount of a transaction has a round number. For example, invoices for £32.00, £99.00 and £200.00 are all round sum values, whereas values such as £31.99 or £199.59 are not. Round sum values may indicate possible fraudulent activity and a need for further investigation. The report offers insights into what proportion of transactions have round sum values.
Report structure
The Round Sum report shows the percentage of transactions that have round sums per data type per month. The report displays three years of historic data from the month the report was generated. If your data doesn't go back a full three years, only the data you have will be included in the report.
The data types evaluated are Invoices, Payments, Credit Notes, Sales Orders, Bills, Bill Payments, Bill Credit Notes and Purchase Orders. Make sure these are enabled as disabled data types are not evaluated.
The image below is an extract of the Round Sum report. Borders and styling were added to this image for clarity but is not included in the downloadable Excel file.
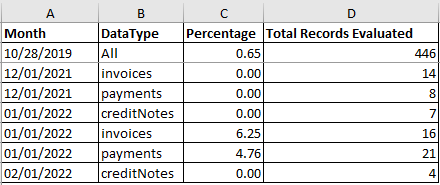
The report provides a row per data type per month and shows the records with round sums as a percentage of the total records evaluated for that month.
The All field shows the total percentage of records with round sums compared to all records evaluated over three years. In this example, 0.65% of 446 records evaluated had round sum values. Taking rounding errors into account, this equals 3 records. The date next to the All button signifies the start of the three-year period or the date of the earliest data available.
Metrics for partial months are included, but are excluded from the calculation of the monthly mean and standard deviation. For example, when generating the report mid-month, the first and last month's records will not be included in the monthly mean and standard deviation calculations.
Records that have a Draft status are excluded from the evaluation.
Blank Descriptions
Transactions without descriptions lack context and is a sign of poor accounting practices or fraudulent behavior. The report offers insights into what proportion of transactions have blank descriptions.
Report structure
The Blank Descriptions report shows the percentage of transactions that have blank descriptions per data type per month. The report displays three years of historic data from the month the report was generated. If your data doesn't go back a full three years, only the data you have will be included in the report.
The data types evaluated are Invoices, Payments, Credit Notes, Sales Orders, Bills, Bill Payments, Bill Credit Notes and Purchase Orders. Make sure these are enabled as disabled data types are not evaluated.
The image below is an extract of the Blank Descriptions report. Borders and styling were added to this image for clarity but is not included in the downloadable Excel file.
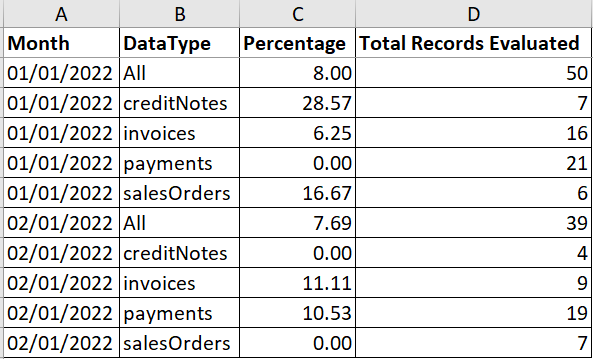
Each month shows the percentage of blank descriptions per data type as well as the totals provided in the All rows.
In this example, January has blank descriptions for creditNotes (2), invoices (1) and salesOrders (1). There is a total of 8% of 50 transactions evaluated for January that have blank descriptions. This translates to 4 transactions containing blank descriptions for the month of January.
Metrics for partial months are included, but are excluded from the calculation of the monthly mean and standard deviation. For example, when generating the report mid-month, the first and last month's records will not be included in the monthly mean and standard deviation calculations.
Outside Working Hours
Records that are updated out of working hours can be a sign of fraudulent activity. The report offers insights into what proportion of transactions have been updated over a weekend.
The Outside Working Hours metric is an effective measure for larger SMBs, ones that would typically carry out accounting activities during office hours.
Report structure
The Outside Working Hours metric shows the percentage of records that were updated out of working hours per data type per month. The report displays three years of historic data from the month the report was generated. If your data doesn't go back a full three years, only the data you have will be included in the report.
The data types evaluated are Invoices, Payments, Credit Notes, Sales Orders, Bills, Bill Payments, Bill Credit Notes and Purchase Orders. Make sure these are enabled as disabled data types are not evaluated.
The image below is an extract of the Outside Working Hours metric. Borders and styling were added to this image for clarity but is not included in the downloadable Excel file.
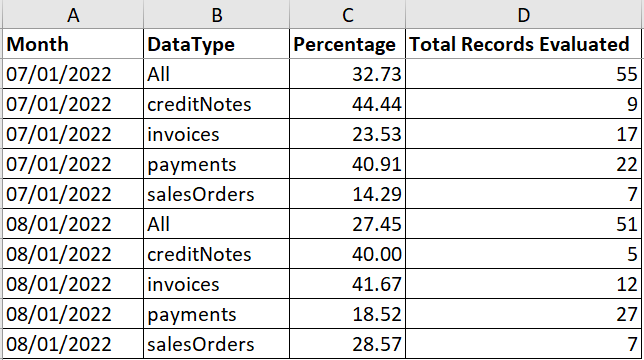
Each month shows the percentage of transactions that were updated outside of working hours per data type as well as the totals provided in the All rows.
In this example, July shows transactions that were updated outside of working hours for creditNotes (4 records), invoices (4), payments (9) and salesOrders (1). There is a total of 32.73% of 55 records evaluated for July that were updated out of working hours. This translates to 18 transactions.
Metrics for partial months are included, but are excluded from the calculation of the monthly mean and standard deviation. For example, when generating the report mid-month, the first and last month's records will not be included in the monthly mean and standard deviation calculations.
Backdated Records
Records where the date it was created in the accounting system is later than its closure date is an indication of a problem. Either the accounts are not accurate (as they don't report records as they happen) or the company is involved in fraudulent activity, such as overstating revenue.
Report structure
The Backdated Records metric shows the percentage of records that were backdated per data type per month. The report displays three years of historic data from the month the report was generated. If your data doesn't go back a full three years, only the data you have will be included in the report.
The data types evaluated are Invoices and Bills. Make sure these are enabled as disabled data types are not evaluated.
The image below is an extract of the Backdated Records metric. Borders and styling were added to this image for clarity but is not included in the downloadable Excel file.
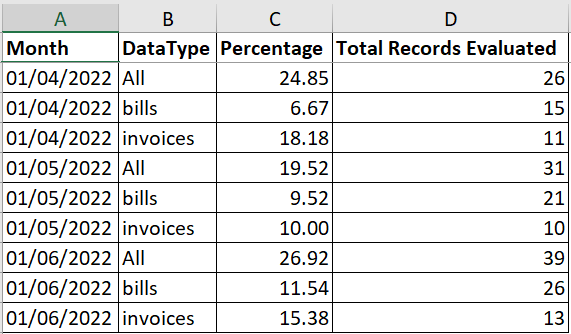
Each month shows the percentage of records that were backdated per data type and the totals provided in the All rows.
In this example, April shows records that were backdated for bills (1 record), and invoices (2). There is a total of 24.85% of 26 records evaluated for April that were backdated. This translates to 3 records.
Metrics for partial months are included, but are excluded from the calculation of the monthly mean and standard deviation. For example, when generating the report mid-month, the first and last month's records will not be included in the monthly mean and standard deviation calculations.